The mining production disparity in India

The mining production disparity in India is a fascinating observation!
Why does Odisha dominate mining production? 🤔 A LinkedIn Exploration!
📊 Here’s a fun fact: Odisha alone contributes a whopping 46% to India’s mining production, and when combined with six other states, the share jumps to 96-97%! Meanwhile, the rest of the states are probably enjoying the view. 😅
Why this imbalance?
Resource Blessing: Odisha is rich in minerals like iron ore, bauxite, and chromite, making it India’s mining hub. The geology simply favors it.
Infrastructure & Industry: The state has well-developed mining and industrial infrastructure. Proximity to ports like Paradip also helps.
Diverse Contributions: Chhattisgarh and Rajasthan also pull their weight with significant coal and marble production.
The Fun Takeaway: Odisha is to mining what “monopoly players” are to real estate — grabbing all the good spots on the board! The other states are just hoping to land Free Parking! 🚀
Let’s applaud the hard-working folks in these regions and brainstorm how other states can enter the game. Your thoughts? 🤔
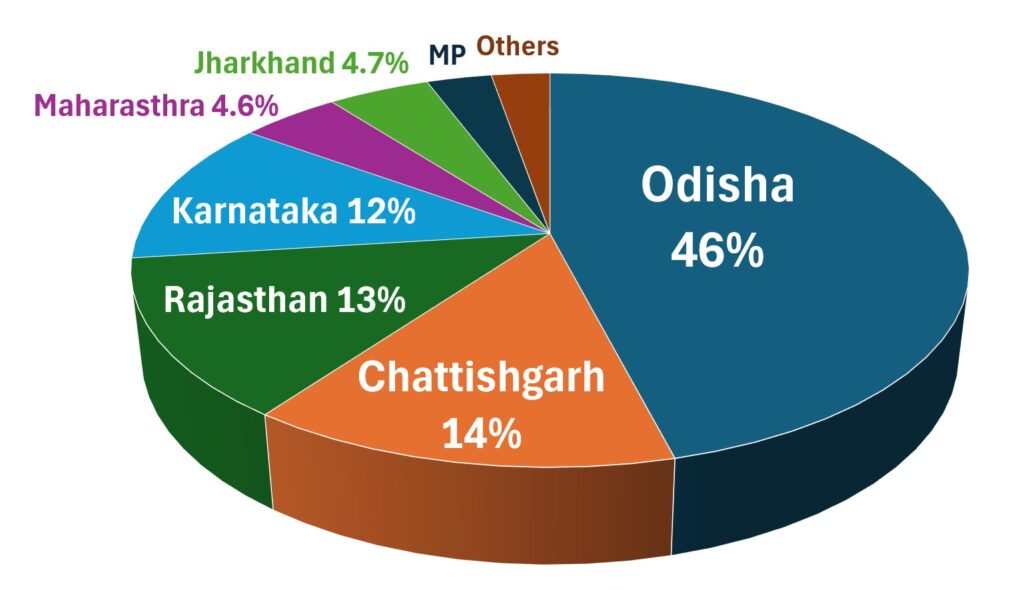
The pie chart illustrates the distribution of India’s production from mines across different states. Odisha emerges as the leading contributor, accounting for a significant 46% of the total production. This dominance is likely due to Odisha’s vast reserves of iron ore, bauxite, and other minerals, coupled with efficient mining operations and favorable geological conditions.
Chhattisgarh contributes 14%, ranking second. This state’s prominence can be attributed to its rich deposits of coal, iron ore, and dolomite, making it a hub for India’s mining industry. Rajasthan follows with 13%, thanks to its abundant reserves of non-metallic minerals like limestone and marble, as well as metallic minerals such as zinc and lead.
Karnataka contributes 12%, benefiting from its rich iron ore deposits, especially in the Bellary region. The state’s mining sector plays a crucial role in supporting the steel industry.
Maharashtra and Jharkhand contribute relatively smaller shares, at 4.6% and 4.7%, respectively. Jharkhand’s contribution stems from its coal and iron ore reserves, while Maharashtra’s output primarily includes manganese and bauxite. Smaller states and regions, grouped as “Others,” along with Madhya Pradesh (MP), collectively make up the remaining portion of the chart.
The chart highlights the geographical concentration of mineral resources in India, with eastern and central states playing a pivotal role in the mining industry. This distribution reflects the geological diversity of India and emphasizes the importance of these regions in sustaining the nation’s industrial growth. However, it also underscores the need for balanced resource utilization to promote equitable development across states.
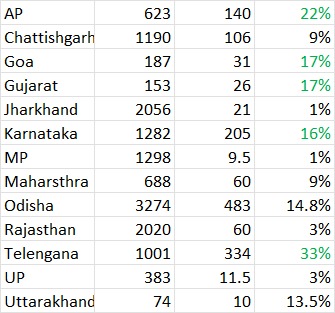
The table provides a state-wise overview of the utilization of District Mineral Foundation (DMF) funds for COVID-19-related activities from 2020 to the present. It highlights the available DMF funds, the expenditures, and the percentage of funds utilized.
Odisha has the highest available DMF fund at ₹3274 crores, with an expenditure of ₹483 crores, resulting in a utilization rate of 14.8%. Despite having the largest fund pool, its utilization rate is moderate, indicating potential room for further spending.
Jharkhand and Rajasthan also have significant DMF reserves at ₹2056 crores and ₹2020 crores, respectively, but their utilization percentages are low at 1% and 3%, reflecting minimal spending on COVID-19-related activities.
Telangana exhibits the highest utilization rate at 33%, spending ₹334 crores from an available fund of ₹1001 crores. Similarly, Andhra Pradesh has a commendable utilization rate of 22%, with ₹140 crores spent out of ₹623 crores.
States like Goa and Gujarat show moderate fund utilization, both at 17%. Goa spent ₹31 crores from ₹187 crores, and Gujarat utilized ₹26 crores from ₹153 crores.
Karnataka demonstrates a relatively high expenditure of ₹205 crores from ₹1282 crores, achieving a 16% utilization rate. Uttar Pradesh (UP) follows closely, utilizing 33% of its ₹383 crore fund, while Uttarakhand shows effective spending with 13.5% utilization.
In contrast, Madhya Pradesh and Jharkhand have the lowest utilization rates, both at 1%, indicating underuse of resources. Maharashtra and Chhattisgarh have moderate utilization rates of 9%, spending ₹60 crores and ₹106 crores, respectively.
Overall, the table reflects varied utilization patterns across states, highlighting efficient spending in some regions and underutilization in others. This disparity underscores the need for targeted strategies to optimize DMF fund usage for pandemic-related activities.
7 thoughts on “The mining production disparity in India”
Leave a Reply
Related Posts
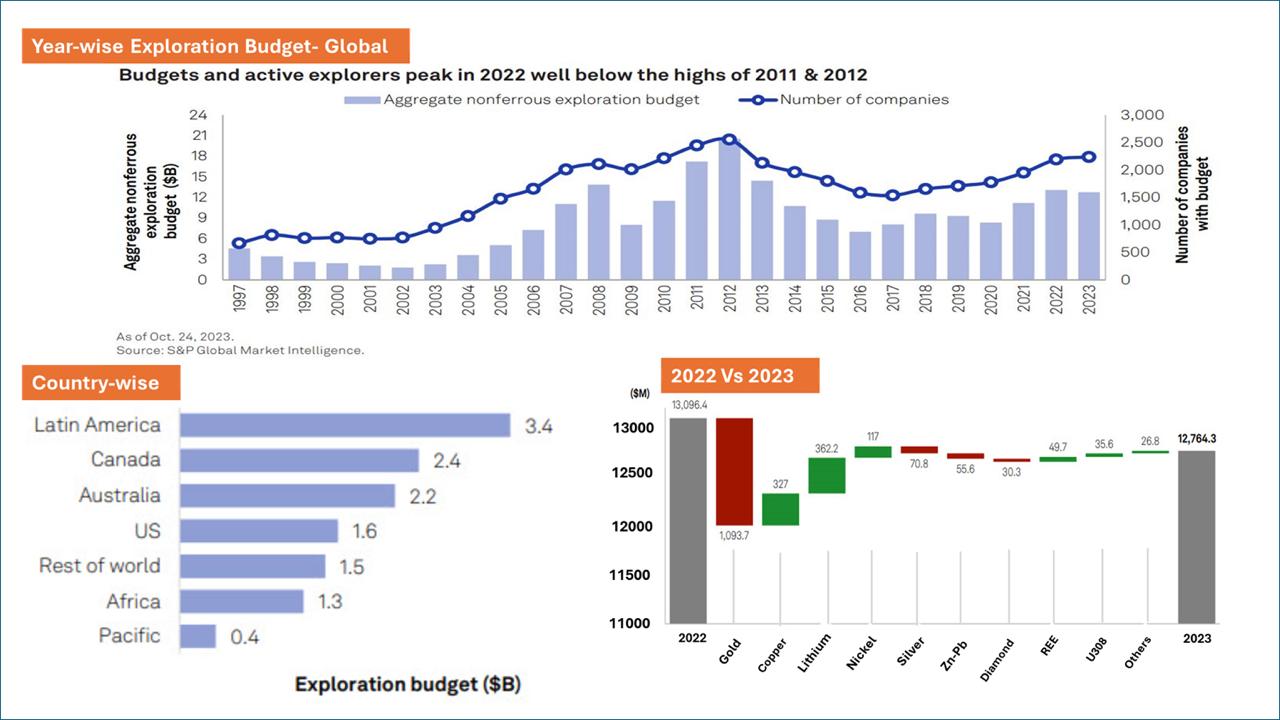
Global Exploration Scenario: Year-wise and Country-wise Budget Insights from 1997 to 2023
Understanding the trends in budgets over the years provides critical insights into the mining industry’s focus and priorities. From 1997 ...
HxGN MinePlan: Pricing, Global Usage, and Acquisition Insights
Overview of HxGN MinePlan HxGN MinePlan, formerly known as MineSight, is a leading mining software suite developed by Hexagon Mining. ...
Clarification regarding inclusion of non-mineralized area in the existing mining lease for the purpose of dumping of mine waste/overburden: 28.11.24
ToThe Secretary,Mineral Resources Department, Government of Chhattisgarh, Indravati Bhavan, Naya Raipur.No. 16/83/2024-Mines VI Government of India Ministry of Mines * ...
6ut048
We are a group of volunteers and starting a new scheme in our community. Your website offered us with helpful info to work on. You’ve performed a formidable task and our whole community will be thankful to you.
Today, I went to the beach with my kids. I found a sea shell and gave it to my 4 year old daughter and said “You can hear the ocean if you put this to your ear.” She placed the shell to her ear and screamed. There was a hermit crab inside and it pinched her ear. She never wants to go back! LoL I know this is entirely off topic but I had to tell someone!
This actually answered my downside, thanks!
5vuuwn
There is noticeably a bundle to know about this. I assume you made certain nice points in features also.
https://t.me/s/flagman_official_777/4